[Nginx Best Practices] Logging time in Nginx
Logging and Timing
The access logging in NGINX is very flexible that you can use to analyze the load and performance of your system. You can also define customized log formats for your application.
Setting Up the Access Log
NGINX writes information about client requests in the access log right after the request is processed. By default, the access log is located at logs/access.log, and the information is written to the log in the predefined combined format. To override the default setting, use the log_format directive to change the format of logged messages, as well as the access_log directive to specify the location of the log and its format. The log format is defined using variables.
NGINX timing variables
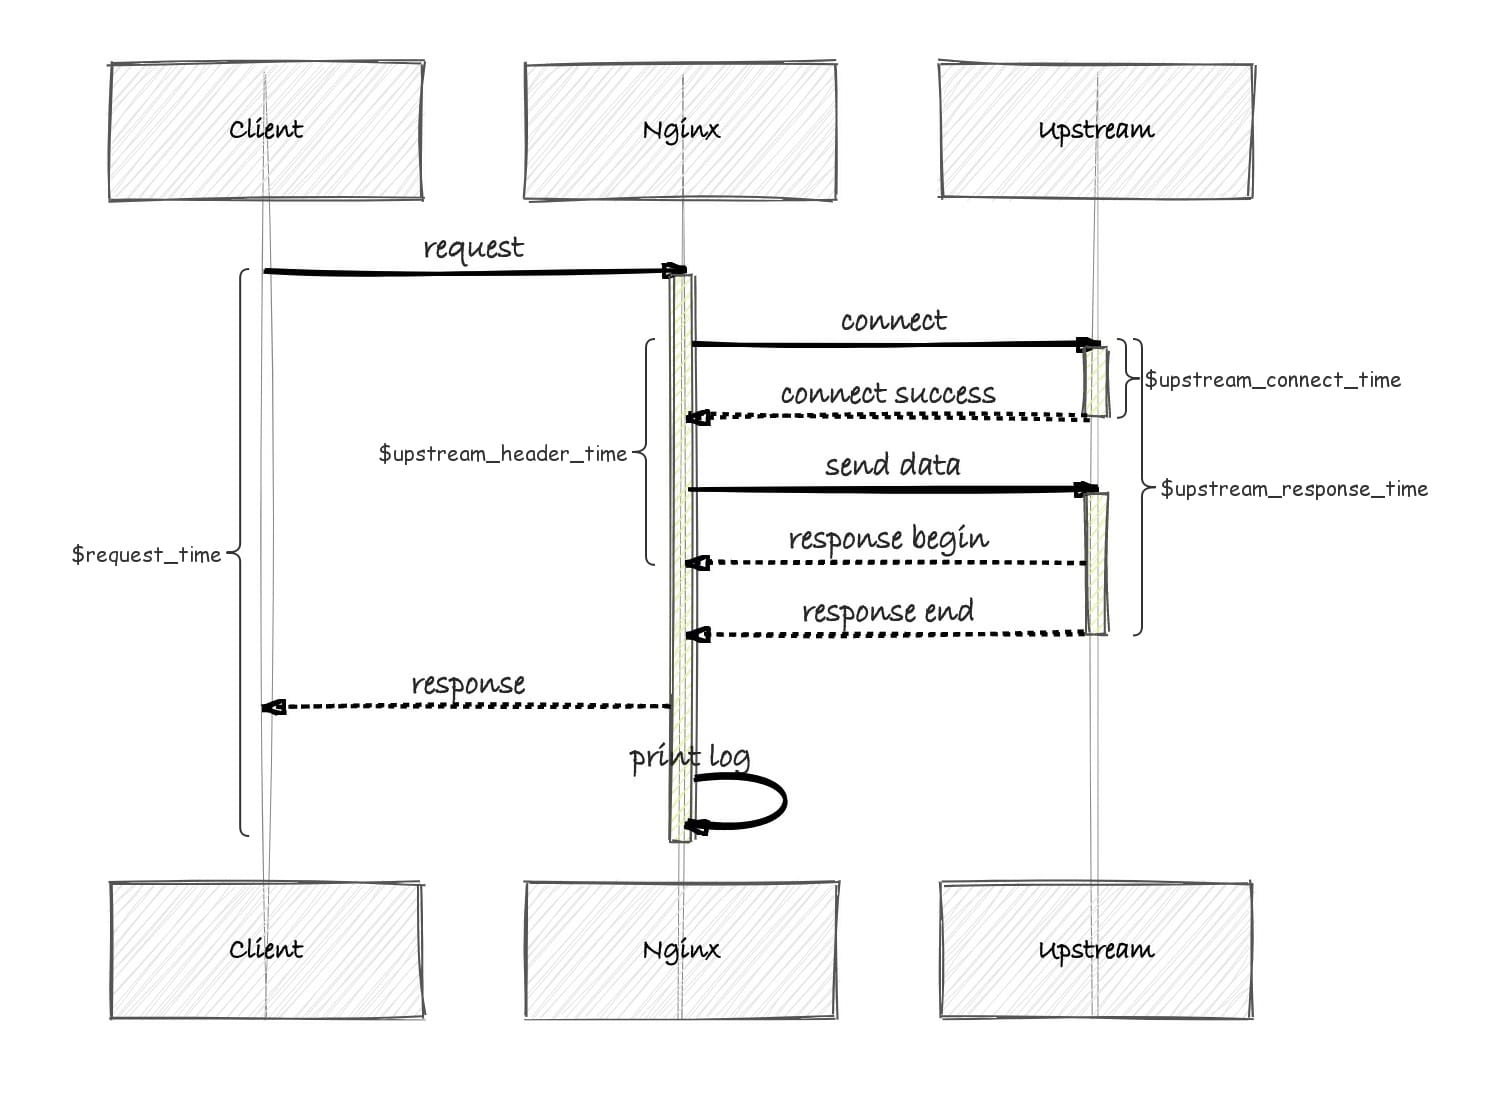
You can use the following variables to log the indicated time values:
-
$upstream_connect_time – The time spent on establishing a connection with an upstream server
-
$upstream_header_time – The time between establishing a connection and receiving the first byte of the response header from the upstream server
-
$upstream_response_time – The time between establishing a connection and receiving the last byte of the response body from the upstream server
-
$request_time – The total time spent processing a request
All time values are measured in seconds with millisecond resolution.
Example:
1 | http { |
Setting Up the Error Log
NGINX writes information about encountered issues of different severity levels to the error log. The error_log directive sets up logging to a particular file, stderr, or syslog and specifies the minimal severity level of messages to log. By default, the error log is located at logs/error.log (the absolute path depends on the operating system and installation), and messages from all severity levels above the one specified are logged.
The configuration below changes the minimal severity level of error messages to log from error to warn:
1 | error_log logs/error.log warn; |
In this case, messages of warn, error crit, alert, and emerg levels are logged.
The default setting of the error log works globally. To override it, place the error_log directive in the main (top-level) configuration context. Settings in the main context are always inherited by other configuration levels (http, server, location). The error_log directive can be also specified at the http, stream, server and location levels and overrides the setting inherited from the higher levels. In case of an error, the message is written to only one error log, the one closest to the level where the error has occurred. However, if several error_log directives are specified on the same level, the message are written to all specified logs.
Note: The ability to specify multiple error_log directives on the same configuration level was added in NGINX Open Source version 1.5.2.
References
[2] NGINX Docs | Configuring Logging - https://docs.nginx.com/nginx/admin-guide/monitoring/logging/
[5] Core functionality - https://nginx.org/en/docs/ngx_core_module.html#error_log
[6] NGINX | High Performance Load Balancer, Web Server, & Reverse Proxy - https://www.nginx.com/