[Infrastructure as Code (IaC) Pulumi] Use Pulumi kubernetes (K8S) Helm Chart to deploy x509-certificate-exporter
x509-certificate-exporter
x509-certificate-exporter is a Prometheus exporter for certificates focusing on expiration monitoring, written in Go with cloud deployments in mind.
This article is about how to use Pulumi, kubernetes (K8S) provider, Helm Chart and TypeScript SDK to deploy x509-certificate-exporter within Kubernetes (K8S).
Get notified before certificates expire:
-
TLS Secrets from a Kubernetes cluster
-
PEM encoded files, by path or scanning directories
-
Kubeconfigs with embedded certificates or file references
The following metrics are available:
-
x509_cert_not_before
-
x509_cert_not_after
-
x509_cert_expired
-
x509_cert_error (optional)
-
x509_read_errors
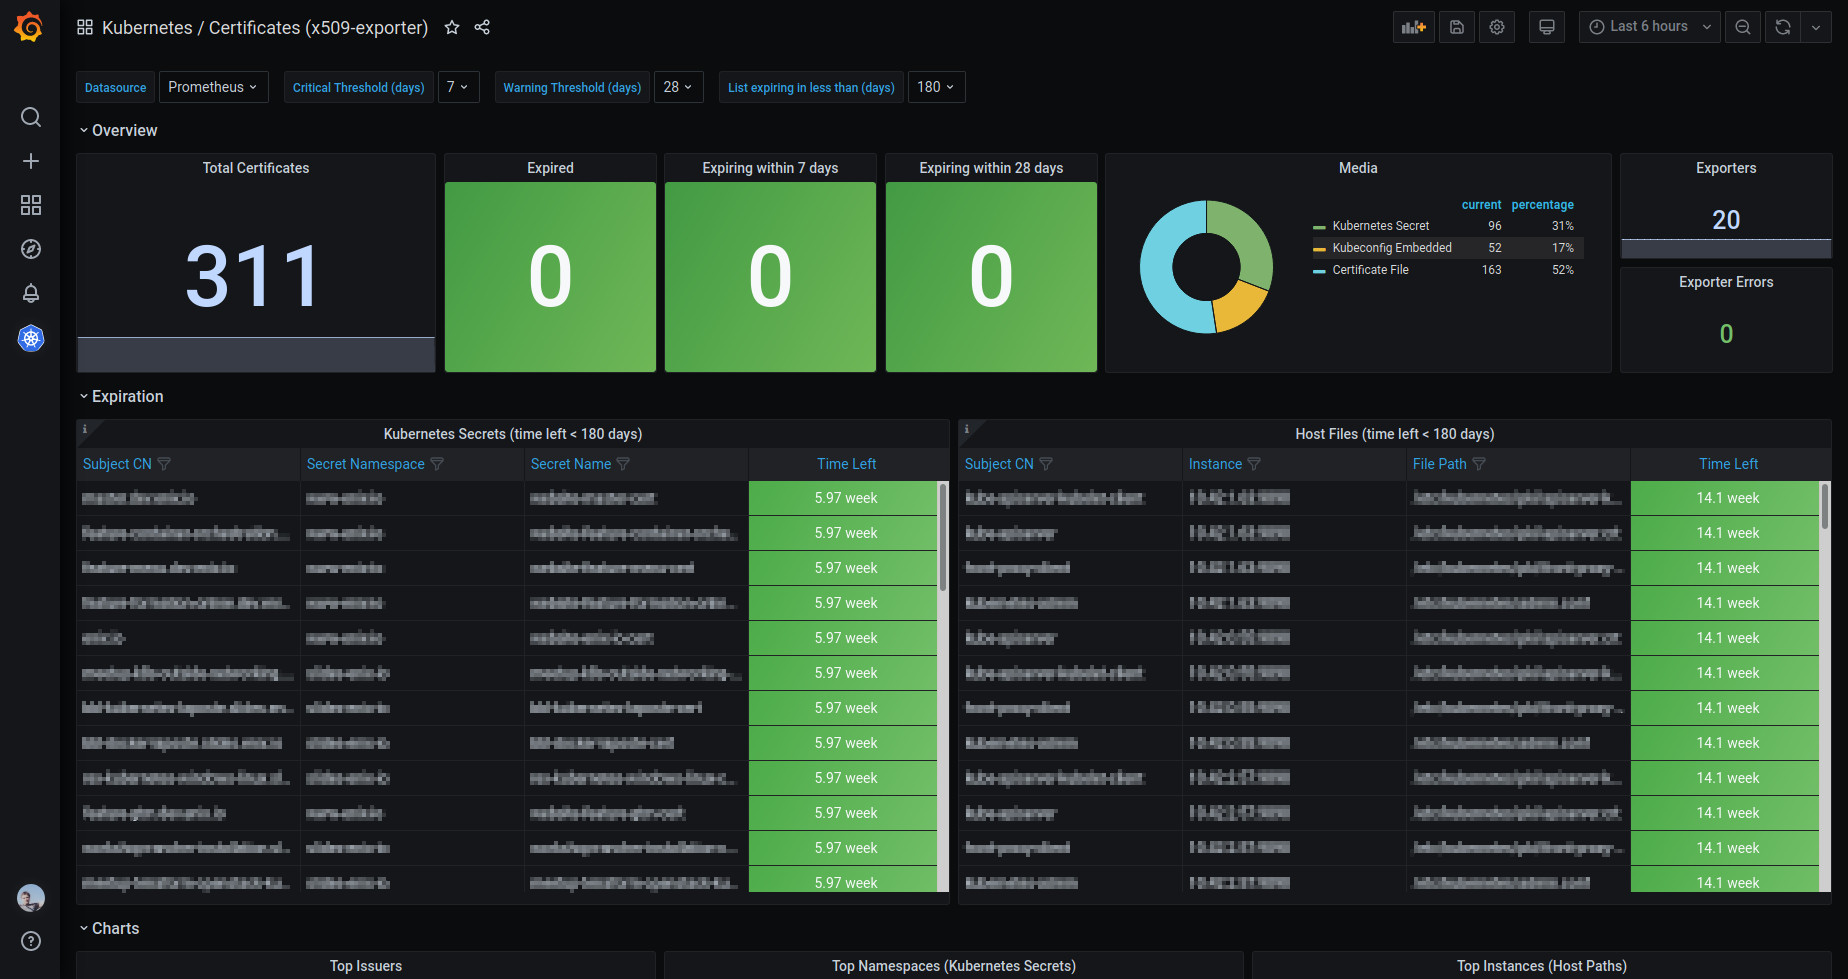
Best when used with the Grafana DashboardCertificates Expiration (X509 Certificate Exporter) dashboard for Grafana | Grafana Labs - https://grafana.com/grafana/dashboards/13922 ID 13922:

Prerequisites
-
Kubernetes (K8s) is an open-source system for automating deployment, scaling, and management of containerized applications.
See Getting started | Kubernetes - https://kubernetes.io/docs/setup/ to leanr more.
-
Pulumi - Modern Infrastructure as Code - https://www.pulumi.com/
Pulumi is a modern infrastructure-as-code platform that allows you to use common programming languages, tools, and frameworks, to provision, update, and manage cloud infrastructure resources.
Install the Pulumi - https://www.pulumi.com/ CLI.
1
2Mac OS X
brew install pulumiSee Download and Install | Pulumi - https://www.pulumi.com/docs/get-started/install/ to learn more about others OS.
-
Node.js - https://nodejs.org/en/
Node.js® is a JavaScript runtime built on Chrome’s V8 JavaScript engine.
Install Node.js - https://nodejs.org/en/ CLI.
1
2Mac OS X
brew install nodeSee Node.js - https://nodejs.org/en/ to learn more about others OS.
-
Prometheus - Monitoring system & time series database - https://prometheus.io/
Prometheus is an open-source systems monitoring and alerting toolkit originally built at SoundCloud. Since its inception in 2012, many companies and organizations have adopted Prometheus, and the project has a very active developer and user community.
There are two choices to install Prometheus on Kubernetes (K8S)
-
Install
kube-prometheus-stackby Helm: -
Install Loki-Stack by Helm:
Helm | Grafana Labs - https://grafana.com/docs/loki/latest/installation/helm/
-
Usage
Pulumi New
Create the workspace directory.
1 | mkdir -p col-example-pulumi-typescript-x509-certificate-exporter |
Pulumi login into local file system.
1 | pulumi login file://. |
Pulumi new a project with kubernetes-typescript SDK.
1 | pulumi new kubernetes-typescript |
The above command will create some files within the current directory.
1 | tree . -L 1 |
Install js-yaml package to load and parse yaml file.
1 | npm i js-yaml |
Pulumi Configuration
Configure Kubernetes
By default, Pulumi will look for a kubeconfig file in the following locations, just like kubectl:
-
The environment variable:
$KUBECONFIG, -
Or in current user’s default kubeconfig directory:
~/.kube/config
If the kubeconfig file is not in either of these locations, Pulumi will not find it, and it will fail to authenticate against the cluster. Set one of these locations to a valid kubeconfig file, if you have not done so already.
Configure Values.yaml
Edit values.yaml and replace content within {{ }}.
1 | # values.yaml |
main.ts
1 | // main.ts |
Pulumi Up
Run pulumi up to create the namespace and pods.
1 | pulumi up |
See pods about x509-certificate-exporter.
1 | kubectl get pods -n x509-certificate-exporter |
Import X509 Certificate Exporter Grafana Dashboard
See Certificates Expiration (X509 Certificate Exporter) dashboard for Grafana | Grafana Labs - https://grafana.com/grafana/dashboards/13922 to learn more.
Pulumi Destroy
Destroy all resources created by Pulumi.
1 | pulumi destroy |
FAQs
Panel plugin not found: grafana-piechart-panel
First, enter into the
1 | exec kubectl exec -i -t <grafana> -c grafana -- sh -c "clear; (bash || ash || sh)" |
Use the new grafana-cli tool to install grafana-piechart-panel from the Pod commandline:
1 | grafana-cli plugins install grafana-piechart-panel |
Remember to restart
See Pie Chart plugin for Grafana | Grafana Labs - https://grafana.com/grafana/plugins/grafana-piechart-panel/ to learn more.
References
[5] Helm | Grafana Labs - https://grafana.com/docs/loki/latest/installation/helm/
[7] Kubernetes Getting Started | Pulumi - https://www.pulumi.com/docs/get-started/kubernetes/
[8] Pulumi - Modern Infrastructure as Code - https://www.pulumi.com/
[9] Kubernetes - https://kubernetes.io/
[10] TypeScript: Typed JavaScript at Any Scale. - https://www.typescriptlang.org/