[Kubernetes (K8S) Ingress Nginx] Use Prometheus and Grafana for scraping the metrics of the Nginx Ingress controller
Use Prometheus and Grafana for scraping the metrics of the Nginx Ingress controller
This tutorial will show you how to use Prometheus and Grafana for scraping the metrics of the Nginx Ingress controller.
Prerequisites
-
Kubernetes (K8s) is an open-source system for automating deployment, scaling, and management of containerized applications.
For more information about installing and using Kubernetes (K8s), see the Kubernetes (K8s) Docs.
-
Helm is the best way to find, share, and use software built for Kubernetes.
1
2Mac OS X
brew install helmFor more information about installing and using Helm, see the Helm Docs.
-
ingress-nginx is an Ingress controller for Kubernetes using Nginx as a reverse proxy and load balancer.
See [Installation Guide - Nginx Ingress Controller - https://kubernetes.github.io/ingress-nginx/deploy/] to learn more.
-
The Prometheus monitoring system includes a rich, multidimensional data model, a concise and powerful query language called PromQL, an efficient embedded timeseries database, and over 150 integrations with third-party systems.
See Installation | Grafana Labs - https://grafana.com/docs/loki/latest/installation/ to learn how to install Loki.
Or See Prometheus | Grafana Labs - https://grafana.com/oss/prometheus/ to learn how to install Prometheus.
Configuration
The controller should be configured for exporting metrics. This requires 3 configurations to the controller. These configurations are :
-
controller.metrics.enabled=true -
controller.podAnnotations."prometheus.io/scrape"="true" -
controller.podAnnotations."prometheus.io/port"="10254"
Helm
The easiest way to configure the controller for metrics is via helm upgrade. Assuming you have installed the ingress-nginx controller as a helm release named ingress-controller, then you can simply type the command show below :
1 | helm upgrade ingress-controller ingress-nginx/ingress-nginx \ |
Or set values to values.yaml shown below;
1 | # values.yaml |
1 | helm upgrade ingress-controller ingress-nginx/ingress-nginx \ |
Manifest
If you are not using helm, you will have to edit your manifests like this:
Service manifest:
1 | # manifests/Service.yaml |
Or DaemonSet manifest:
1 | # manifests/DaemonSet.yaml |
Run kubectl to apply manifests file
1 | kubectl apply -f manifests/*.yaml |
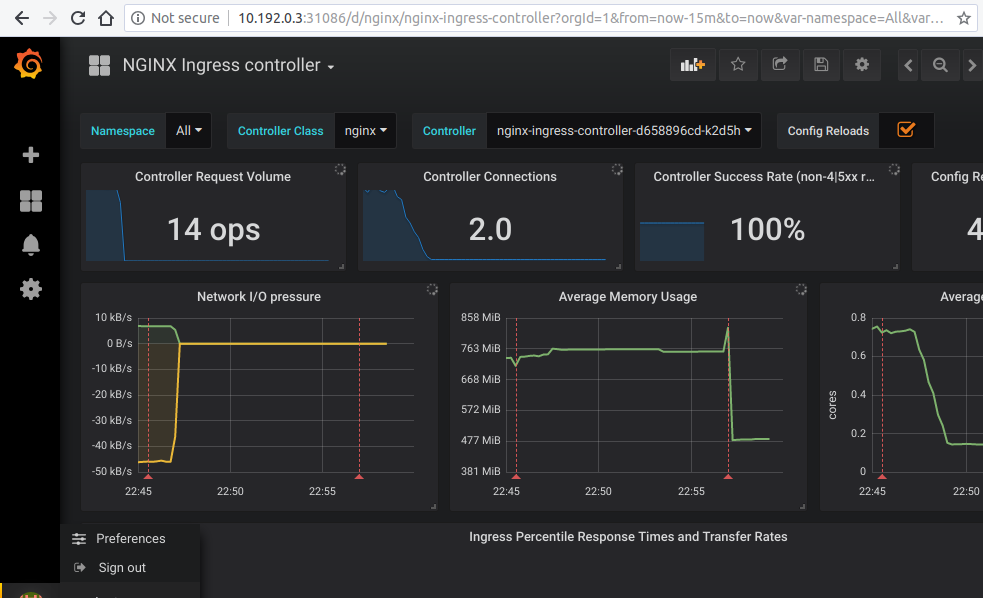
Grafana Dashboard
After the login you can import the Grafana dashboard from official dashboards, by following steps given below :
-
Left menu (hover over
+) ->Dashboard -
Click
Import -
Enter the copy pasted json from
https://raw.githubusercontent.com/kubernetes/ingress-nginx/main/deploy/grafana/dashboards/nginx.json -
Click Import JSON
-
Select the Prometheus data source
-
Click “Import”
Then, follow the steps above to enter the copy pasted json from https://github.com/kubernetes/ingress-nginx/blob/main/deploy/grafana/dashboards/request-handling-performance.json
See ingress-nginx/deploy/grafana/dashboards at main · kubernetes/ingress-nginx - https://github.com/kubernetes/ingress-nginx/tree/main/deploy/grafana/dashboards to learn more.
References
[4] Dashboards | Grafana Labs - https://grafana.com/grafana/dashboards/
[6] Prometheus | Grafana Labs - https://grafana.com/oss/prometheus/
[7] Installation | Grafana Labs - https://grafana.com/docs/grafana/latest/installation/?pg=docs
[8] Installation | Grafana Labs - https://grafana.com/docs/loki/latest/installation/
[9] Grafana Loki | Grafana Labs - https://grafana.com/oss/loki/
[10] Welcome - NGINX Ingress Controller - https://kubernetes.github.io/ingress-nginx/